CXM Direct 2022年第三季度进展报告
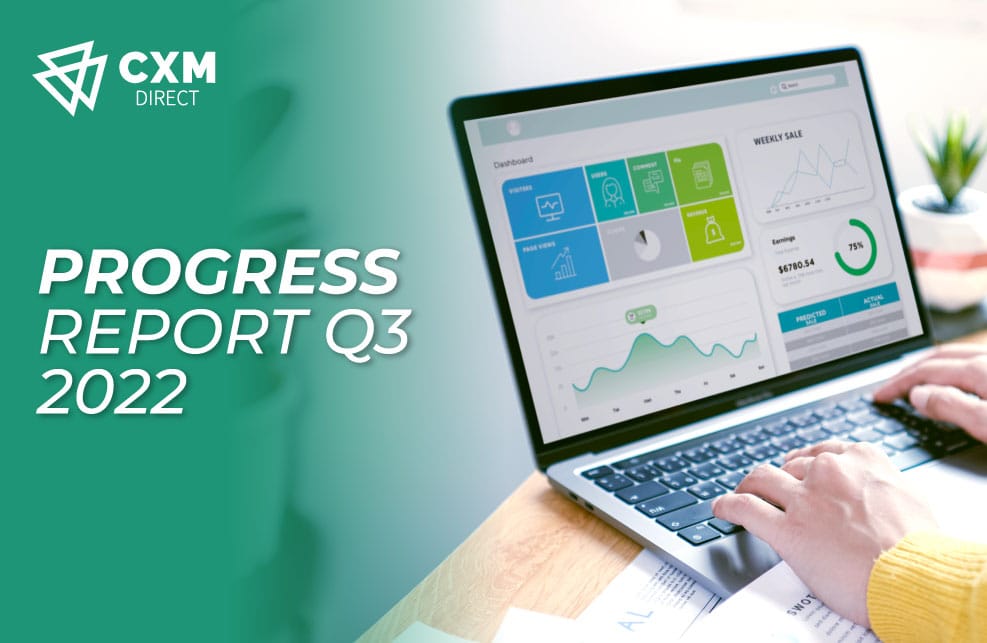
CXM Direct, a fast-growing broker, recently released its latest company update and progress report for Q3 of 2022. The report shows CXM Direct performance over the past three months, including updates on its latest developments.
CXM Direct has seen healthy growth during Q3 of 2022. Its Notional Trade Volume increased by 27% in the 3rd quarter vs. Q2 and hit a new all-time high. The number of trades set a new record in Q3 2022 and grew by 28% from Q2.


The trading activity of CXM Direct clients grew substantially in the same quarter, and Partner Commission per trade also increased by 34% as a consequence. In addition, Active Clients of CXM Direct also grew by 44% vs. Q2, 2022 reaching a new all-time high.


In Q3, CXM Direct’s average execution speed across all order types improved again. In September 2022, its average speed reached 61 milliseconds. CXM Direct continued to improve the overall average and its distribution. Its Positive vs. Negative slippage ratio remained consistent in the recent quarter. Order quality continued to be strong at 97.39% of all orders executed At Price or Better in Q3 2022.


CXM Direct always strives to innovate and improve its trading solutions. CXM Direct is committed to providing its customers with the best trading experience in the industry. CXM Direct is a technology leader by continuously advancing its execution speeds, reducing order cancellation rates, and providing the most responsive customer support team. In Q3, it achieved record highs in its Notional Trade Volume and Number of Trades.